Without garlic I simply would not care to
livecode. — Louis Diat1
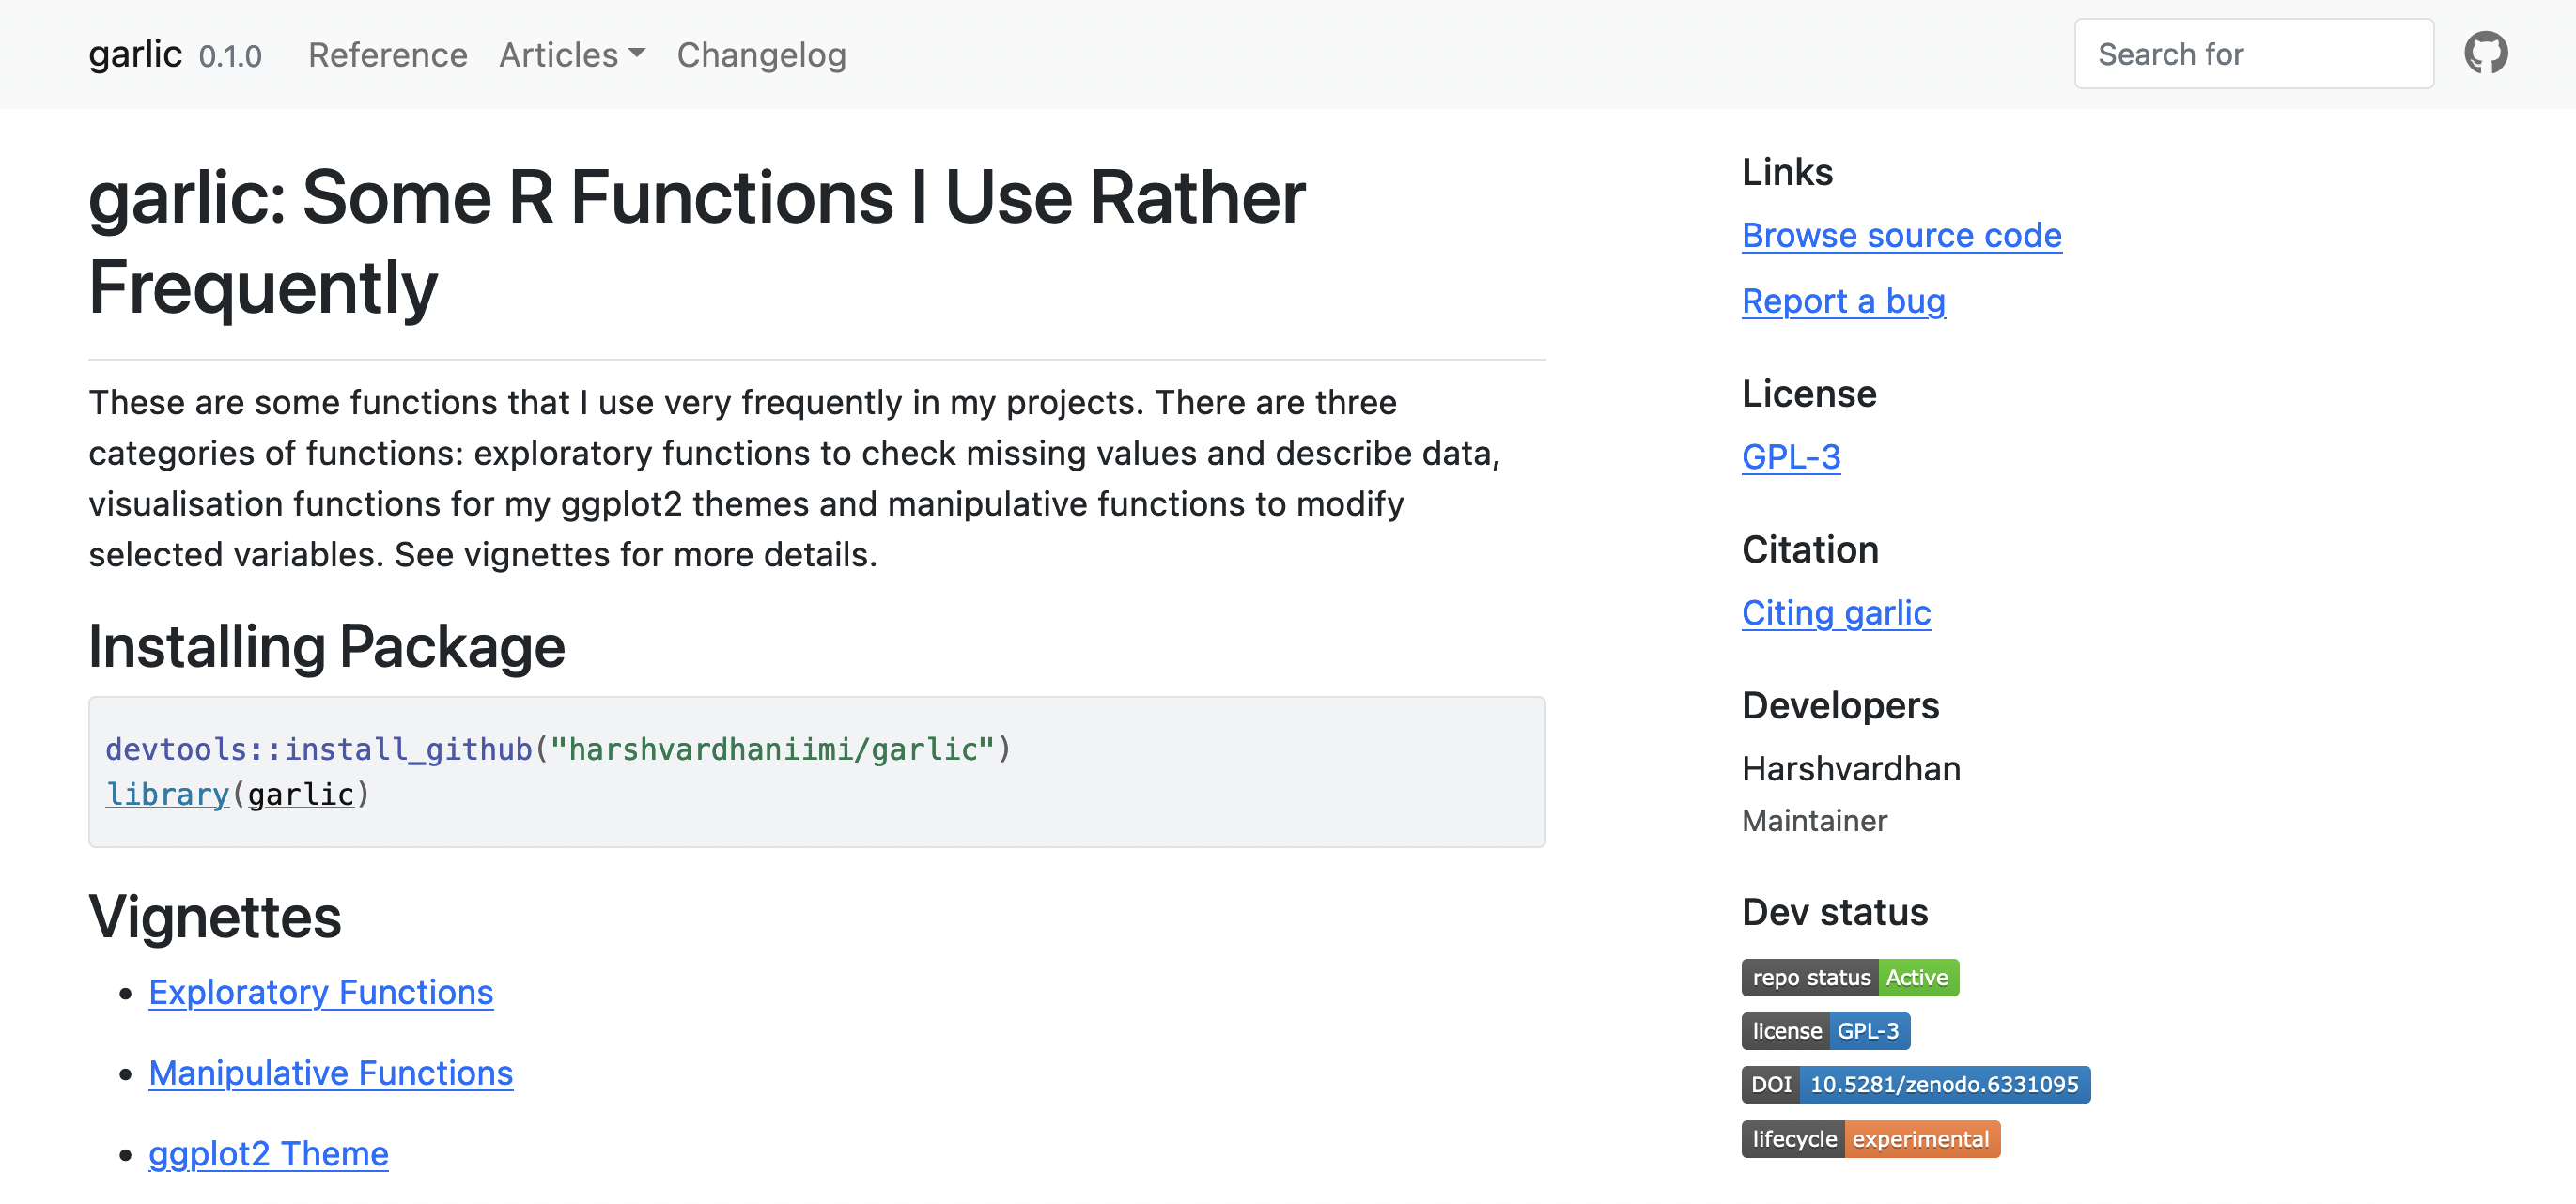
These are some functions that I use very frequently in my projects. There are three categories of functions: exploratory functions to check missing values and describe data, visualisation functions for my ggplot2 themes and manipulative functions to modify selected variables.
Installing the Package
If you don’t have devtools, install that first. devtools provides the function install_github() which can be used to install R packages hosted on Github.
install.packages("devtools")
#devtools::install_github("harshvardhaniimi/garlic")
library(garlic)
Exploratory Functions
There are three exploratory functions. This vignette demonstrates how exploratory functions like show_in_excel(), which_na() and which_this() can be used.
library(garlic)
Examples
df = iris
Show a data frame in MS Excel
I found this function on Twitter but can’t find that tweet anymore. (Update: Bruno Rodrigues created this function. Here’s the tweet.)
show_in_excel(df)
It can also be used with pipes.
library(dplyr)
df %>%
   show_in_excel()
Which values are missing?
I’m initialising a vector from 1 to 10 with fifth value as missing NA.
x = c(1:4, NA, 6:10)
Using which_na(), I can find index of element in the vector which is NA.
which_na(x)
## [1] 5
Which element is this?
It can identify values that satisfy a criteria. It is kind of a wrapper around dplyr’s filter().
which_this(iris, "Sepal.Length > 7")
##    Sepal.Length Sepal.Width Petal.Length Petal.Width   Species
## 1           7.1         3.0          5.9         2.1 virginica
## 2           7.6         3.0          6.6         2.1 virginica
## 3           7.3         2.9          6.3         1.8 virginica
## 4           7.2         3.6          6.1         2.5 virginica
## 5           7.7         3.8          6.7         2.2 virginica
## 6           7.7         2.6          6.9         2.3 virginica
## 7           7.7         2.8          6.7         2.0 virginica
## 8           7.2         3.2          6.0         1.8 virginica
## 9           7.2         3.0          5.8         1.6 virginica
## 10          7.4         2.8          6.1         1.9 virginica
## 11          7.9         3.8          6.4         2.0 virginica
## 12          7.7         3.0          6.1         2.3 virginica
Manipulative Functions
There are two mutating functions that modify data frames in a certain way. na_rm_feature() is used for removing observations based on a single variable. na_to_zero() converts missing values to zero.
library(garlic)
Examples
Removing Rows Based on Missing Values in a Column
Sometimes, I do not want to na.omit() because it will treat all features equally. I want to check values only for one column, while removing those observations.
# First ten rows of iris dataset
df = iris[1:10,]
df
##    Sepal.Length Sepal.Width Petal.Length Petal.Width Species
## 1           5.1         3.5          1.4         0.2  setosa
## 2           4.9         3.0          1.4         0.2  setosa
## 3           4.7         3.2          1.3         0.2  setosa
## 4           4.6         3.1          1.5         0.2  setosa
## 5           5.0         3.6          1.4         0.2  setosa
## 6           5.4         3.9          1.7         0.4  setosa
## 7           4.6         3.4          1.4         0.3  setosa
## 8           5.0         3.4          1.5         0.2  setosa
## 9           4.4         2.9          1.4         0.2  setosa
## 10          4.9         3.1          1.5         0.1  setosa
# Setting second sepal width to NA
df$Sepal.Width[2] = NA
df
##    Sepal.Length Sepal.Width Petal.Length Petal.Width Species
## 1           5.1         3.5          1.4         0.2  setosa
## 2           4.9          NA          1.4         0.2  setosa
## 3           4.7         3.2          1.3         0.2  setosa
## 4           4.6         3.1          1.5         0.2  setosa
## 5           5.0         3.6          1.4         0.2  setosa
## 6           5.4         3.9          1.7         0.4  setosa
## 7           4.6         3.4          1.4         0.3  setosa
## 8           5.0         3.4          1.5         0.2  setosa
## 9           4.4         2.9          1.4         0.2  setosa
## 10          4.9         3.1          1.5         0.1  setosa
# Removing that observation
df = na_rm_feature(df, "Sepal.Width")
df
##    Sepal.Length Sepal.Width Petal.Length Petal.Width Species
## 1           5.1         3.5          1.4         0.2  setosa
## 3           4.7         3.2          1.3         0.2  setosa
## 4           4.6         3.1          1.5         0.2  setosa
## 5           5.0         3.6          1.4         0.2  setosa
## 6           5.4         3.9          1.7         0.4  setosa
## 7           4.6         3.4          1.4         0.3  setosa
## 8           5.0         3.4          1.5         0.2  setosa
## 9           4.4         2.9          1.4         0.2  setosa
## 10          4.9         3.1          1.5         0.1  setosa
Changing Missing Values to Zero
This function converts missing values to zero.
# First ten rows of iris dataset
df = iris[1:10,]
df
##    Sepal.Length Sepal.Width Petal.Length Petal.Width Species
## 1           5.1         3.5          1.4         0.2  setosa
## 2           4.9         3.0          1.4         0.2  setosa
## 3           4.7         3.2          1.3         0.2  setosa
## 4           4.6         3.1          1.5         0.2  setosa
## 5           5.0         3.6          1.4         0.2  setosa
## 6           5.4         3.9          1.7         0.4  setosa
## 7           4.6         3.4          1.4         0.3  setosa
## 8           5.0         3.4          1.5         0.2  setosa
## 9           4.4         2.9          1.4         0.2  setosa
## 10          4.9         3.1          1.5         0.1  setosa
# Setting second sepal width to NA
df$Sepal.Width[2] = NA
df
##    Sepal.Length Sepal.Width Petal.Length Petal.Width Species
## 1           5.1         3.5          1.4         0.2  setosa
## 2           4.9          NA          1.4         0.2  setosa
## 3           4.7         3.2          1.3         0.2  setosa
## 4           4.6         3.1          1.5         0.2  setosa
## 5           5.0         3.6          1.4         0.2  setosa
## 6           5.4         3.9          1.7         0.4  setosa
## 7           4.6         3.4          1.4         0.3  setosa
## 8           5.0         3.4          1.5         0.2  setosa
## 9           4.4         2.9          1.4         0.2  setosa
## 10          4.9         3.1          1.5         0.1  setosa
na_to_zero(df$Sepal.Width)
## [1] 3.5 0.0 3.2 3.1 3.6 3.9 3.4 3.4 2.9 3.1
ggserif() Theme
I converted axes to directed arrows and made background grid more transparent. In academic publications, serif fonts are often preferred. Thus serif fonts are used.
library(garlic)
library(ggplot2)
library(dplyr)
##
## Attaching package: 'dplyr'
## The following objects are masked from 'package:stats':
##
##     filter, lag
## The following objects are masked from 'package:base':
##
##     intersect, setdiff, setequal, union
library(patchwork)
This theme upgrades basic ggplot2 themes. It is particularly suitable for academic publications that require serif fonts for labels and arrowed axes.
Visually Comparing with Default, Linedraw and Dark Themes
Among the themes available in ggplot2, linedraw is my favourite.
p1 = iris %>%
  ggplot(aes(x = Sepal.Length, y = Sepal.Width, colour = Species)) +
  geom_point() +
  labs(title = "Default Theme")

p2 = iris %>%
  ggplot(aes(x = Sepal.Length, y = Sepal.Width, colour = Species)) +
  geom_point() +
  labs(title = "theme_minimal()") +
  theme_linedraw()

p3 = iris %>%
  ggplot(aes(x = Sepal.Length, y = Sepal.Width, colour = Species)) +
  geom_point() +
  labs(title = "theme_dark()") +
  theme_dark()

p4 = iris %>%
  ggplot(aes(x = Sepal.Length, y = Sepal.Width, colour = Species)) +
  geom_point() +
  labs(title = "ggserif()") +
  ggserif()
# Using patchwork, I can easily stitch these plots together.
p1 / p2 / p3 / p4

Setting theme globally
You can set theme globally for all plots using the following command.
theme_set(ggserif())
Citation
Harshvardhan, M. (March 2022). garlic: Some R Functions I Use Rather Frequently. v0.1.0 (r-package). Github, Zenodo. https://doi.org/10.5281/zenodo.6331095
-
Louis Diat was a French-American chef. I added the quote because it sounds cool. I called the package
garlicsimply because I love the taste of garlic. ↩︎
Comments